Guest blog by Dr. Jeremy Roschelle, Digital Promise, @roschelle63
Summary: When integrated with curriculum and pedagogy, visual representations that change in time can improve students’ conceptual understanding of mathematics.
To understand mathematics, students need to connect ideas.
For example, the slope of a line is often given as a number — the m in y = mx + b. We can measure the slope with triangles of “rise over run” drawn anywhere and at any size along a straight line in a graph. Why does the measure of rise over run always come out the same?
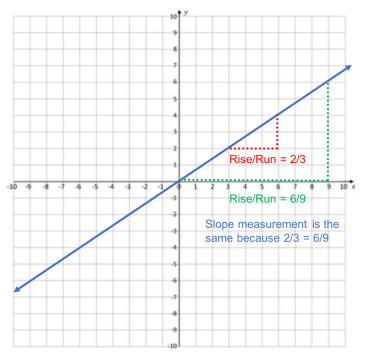
A student can measure rise over run at any pair of points along a line.
The ratio—the slope—will always come out the same. Why?
Fundamentally, slope is connected to concepts of geometric similarity and ratio — m always comes out the same because it is a measure of the ratio of the sides of similar triangles. Alas, too often slope, similarity and ratio are taught as discrete topics with no connection — and mathematics comes across as a bag of unrelated, incomprehensible procedures and, as a consequence most students cannot develop conceptual understanding.
Over the past 25 years, learning scientists have established that time-based representations are an important tool to help students make connections and develop conceptual understanding. For example, with a graphing calculator a student can change the numeric value of a slope and see the corresponding change to the slope of a line. In a dynamic geometry tool like Cabri®, The Geometer’s Sketchpad®, or Geogebra, a student can drag a point in a geometric construction and see how it changes in time — for example, they can see a right triangle not as ONE triangle, but as a family of geometrically similar triangles, all with the same ratio of sides. In a tool like SimCalc (Hegedus & Roschelle, 2013), students can see how the slope of a line corresponds to a rate of change by seeing how the slope controls the speed of an animated football player who is running. Research with SimCalc has established strong benefits to student conceptual understanding when dynamic representations are integrated into the plan for a curricular lesson sequence, and teachers have received related teacher professional development (Roschelle et al, 2010). In addition, a recent review of the research literature supports the use of dynamic representations for conceptual understanding more generally (Roschelle, et al, 2017).
Defining Dynamic Representations
A dynamic representation is a visual depiction of a mathematical object that changes in time, consistent with the mathematical properties of the object. For example, in the video below, a triangle is defined by the lines connecting three points. The points can be moved, and the properties of a triangle are preserved, for example, that the three angles always add up to 180 degrees. Note that this triangle can be deformed into any type of triangle (e.g. a right triangle, an isosceles triangle, an equilateral triangle, etc.).
The “why” of dynamic representations begins with the mathematics itself. Time in a representation helps with at least three aspects of mathematics:
First, mathematics is about generalities, not only individual objects, pictures or shapes. For example, consider a proof like the proof of the Pythagorean Theorem. Importantly, this proof needs to apply to all right triangles, not just one. Yet, when a teacher draws a right triangle on board to start the proof, (s)he often draws just one triangle and talks only about that one drawing. Students can mistakenly think the proof is about a single, special triangle. With a dynamic representation, students can see that the lesson is about a set of related triangles not just one. When students see the smooth changes of a single triangle into all similar triangles, they can experience the intended generality more directly. The video below shows a teacher giving students a challenge in preparation for talking about the Pythagorean Theorem. Notice how she makes clear that the theorem will apply to all right triangles, not just one.
(Also, notice that unlike the triangle in the earlier video, above, this one can only be changed into right triangles – not to other types of triangles. For example, it cannot be transformed and equilateral triangle. Dynamic representations constrain objects to have mathematical properties, relevant to the mathematical activity.)
Second, mathematics is about what changes (varies) and what stays the same (remains invariant). Using a time dimension, we can see what changes about a triangle, but also what stays the same. More generally, mathematics is about systems of rules that limit what is possible. People are good at experiencing and making sense of how rules play out over time (this is what makes games fun) but not so good at imagining all the possibilities that arise from a given set of rules at a glance. Notice in the above video there are three squares. You may recall that the Pythagorean Theorem is a2 + b2 = c2. When the teacher changes the triangle, the squares change orientation and size. What remains the same? Each square has a side that matches a side of the triangle, and thus the square on triangle side “a” has area a2. This invariant—that no matter how you move the right triangle, the squares always have areas of a2, b2, and c2—is important to the students’ later thinking about a right triangle with sides of length a, b, and c. (You might also notice a difference in the first and second videos. In the first video, moving a point can result in an equilateral triangle, with three equal, internal angles. Why can’t a right triangle also be an equilateral triangle?
Third, the same mathematical idea can often be represented in multiple forms. For example, the slope is a single number but is also a ratio of two rise over run. A time dimension allows a student to see how changing a rise-over-run triangle results in changing two different numbers for the length of its sides, and that while these two numbers change, their ratio always remains the same. The thing being measured (a shape) and the measurement (a ratio) are related in time, and a student can see why some things vary (the rise and the run each change) but others remain the same (the ratio of rise over run). Below is a PhET simulation in which you can play with these relationships.
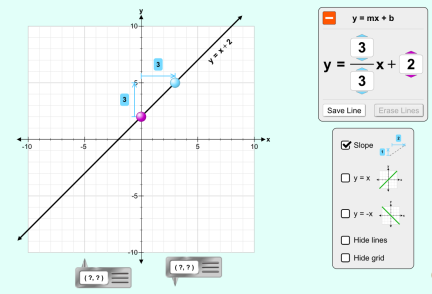
https://phet.colorado.edu/sims/html/graphing-slope-intercept/latest/graphing-slope-intercept_en.html
What are students connecting?
Although the particulars differ with each new mathematical topic, a simple grid can be helpful in thinking about connections that help students to make sense of mathematics. On one side of the grid, representations are either visual (in pictures) or linguistic (in words). On the other side, representations are either commonsense or formal. In the example table below, keep in mind that speed is distance divided by time (r=d/t), and this is true in all the table entries.
| commonsense | formal | |
| visual | seeing a football player running faster | the steeper slope of a line in a graph relating time and distance |
| linguistic | “he’s running faster than before!” | y = mx + b with a bigger number for m |
Which dynamic representations support learning?
Technology has made it much easier to provide dynamic representations to students because technology can enable us to create objects on a screen that change in time. But not all uses of time in a technology-based representation are helpful to students.
Good dynamic representations engage the visual and linguistic commonsense that students already have — students should be able to make sense of the visual and tell stories about it, for instance. And should be able to connect these to more formal mathematical elements. Hence in the SimCalc environment, students tell stories about motion and connect these to graphs and equations.
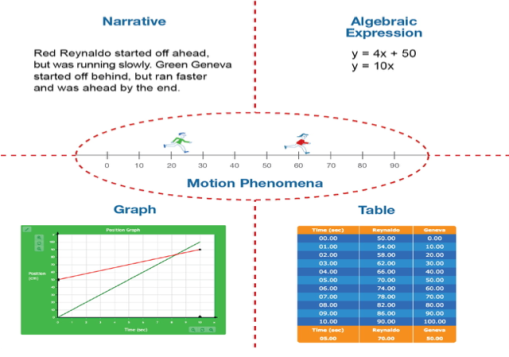
In SimCalc, students relate four different representations to animated motions
Students learn more when the representations that are changing are simple and mathematical — stripped to the essence of the mathematics. This keeps cognitive load low — students spend less effort to sort out relevant from irrelevant features. For example, in seeing a running football player, detail on how their arms move is not helpful but the overall speed of motion and how it relates to slope is helpful. A good dynamic representation rarely looks like a complex dashboard or a gorgeous painting; good ones usually look quite minimal and abstract-but-not-obscure.
A related point is that, whenever possible, the moving elements should be mathematical in nature. While you’ll find a geometric point in a purely mathematical diagram, you won’t find a slider or scroll bar in a mathematics textbook. Sliders are user experience elements that designers have created, but which don’t have an intrinsic mathematical meaning — mathematically, they’re arbitrary. It’s hard for students to make sense of things that have arbitrary mathematical meanings. Points in a Cartesian plane have an intrinsic mathematical meaning, which makes it easier for students to understand their actions in mathematical terms. Since the goal of learning in math is to connect mathematical ideas, keeping the complexity of non-mathematical ideas as low as possible is essential.
A dynamic representation should also focus on the desired connections between different representations. If the goal is for a student to see how the number for ‘m’ in an equation relates to the slope of a visual line, then the changes of these two things in time should be closely linked. Likewise, if the linguistic element will be engaged by student story-telling, then the motion in time should take place over a reasonable amount of time to tell a story — say 10 seconds — but not a half a second or 5 minutes. To see these connections, it is often essential to have the student control the changing feature. Moving a first object yourself and seeing how other representations change is a different experience from watching a movie of someone else who is simultaneously changing a lot of things. It’s easier to explore and make sense of the connections when you can control what is changing.
Overall, it’s important to realize that an expert can much more easily cut through the complexity of a changing visualization than a novice can. The expert already knows what it’s important to pay attention to and what to look for. Since most students do not (i.e., the essence of being a student is that you’re not an expert!), keeping the experience simple, compact and focused is paramount. The acid test here is whether a student can focus on the intended connections as they work with the representation — or whether they have to overcome other obstacles and districts to focus on the mathematics. This is often referred to as seductive details; A seductive detail is an element added to instructional materials that is highly interesting to the audience members, but not directly relevant to the instructional goal. John Sweller (1994) uses the term “extraneous cognitive load” for this.
In conclusion, dynamic representations are time-based based mathematical visualizations, and they can help students to build correct connections among mathematical concepts. Connecting concepts is essential to understanding mathematics. Next week, we will examine how teachers can integrate dynamic representations into lesson plans and coupled with pedagogical moves; as no technology directly causes learning, integration is necessary to effective classroom use.
Jeremy Roschelle is the Executive Director of Learning Sciences Research at Digital Promise Global, a California-based nonprofit research organization. His research focuses on how to integrate technology into teaching and learning systems to enable all students to learn important mathematics. Dr. Roschelle may be contacted on Twitter at @roschelle63
References
Hegedus, S. & Roschelle, J. (Eds.) (2013). The SimCalc vision and contributions: Democratizing access to important mathematics. Berlin, Germany: Springer Verlag.#
Roschelle, J., Noss, R., Blikstein, P., & Jackiw, N. (2017). Technology for learning mathematics. In J. Cai (Ed.), Compendium for research in mathematics education. Reston, VA: National Council of Teachers of Mathematics. 273-296.
Roschelle, J., Shechtman, N., Tatar, D., Hegedus, S., Hopkins, B., Empson, S., Knudsen, J. & Gallagher, L. (2010). Integration of technology, curriculum, and professional development for advancing middle school mathematics: Three large-scale studies. American Educational Research Journal, 47, 833-878
Sweller, J. (1994). Cognitive load theory, learning difficulty, and instructional design. Learning and instruction, 4(4), 295-312.

Reblogged this on kadir kozan.
LikeLike
Great post! I agree that teachers need to make the connections explicit and using virtual tools is one way to show how these concepts intercept. I also think it is extremely important for kids to have hands on experiences at all ages to cement these ideas. This is especially important when initially learning a concept to connect real life application
LikeLike